DTM Module
The Makai Digital Terrain Model, or DTM, is an optional module for MakaiPlan that enables planners to easily process and visualize original survey X,Y,Z point data. Users can visualize the bottom features that may impact the cable installation. DTM allows users to process and transform raw survey data into easily recognizable maps, images, and contours from which to view the seafloor conditions including bottom slopes along and across the route.
Using an automated wizard, DTM can import and divide large survey datasets into a series of overlapping data blocks. The automation tools enable users to grid data rapidly and easily, create and view grid maps, shaded relief maps, and create GeoTIFFs. Once the 3D survey data is imported, all of the usual MakaiPlan features, such as superimposing the RPL on the map and generating depth and slope graphs, can be performed.
With DTM, it is no longer necessary to purchase and learn different software packages from different vendors to process digital terrain data. The entire planning process can be performed within MakaiPlan, increasing the accuracy and efficiency of the design process.
Makai’s Digital Terrain Modeling Tool Demo
Allows Users to…
-
- Load, process, and edit the survey data
- Create grid files using a variety of methods
- Create contour colored maps (colors, numbers, and spacing of contour lines are user defined and maps can be directly loaded into the GIS database), which allow the user to visualize either water depths or the maximum seabed slopes.
- Create color shaded relief maps with user definable sun elevation and azimuth.
- Superimpose the RPL on any of the created maps and quickly generate accurate slope graphs along and across any desired route section. These along and across path profiles are generated by cutting an accurate slice through the entire grid, and therefore, can be used to compute more accurate values of seabed distances and slacks than those computed using the conventional method of intersecting bathymetric contours.
- All maps can be automatically geo-referenced as Geotiffs and be viewable as layers on the main MakaiPlan GIS window.
- Optionally, the capability to load and visualize sections of the survey data in 3D.

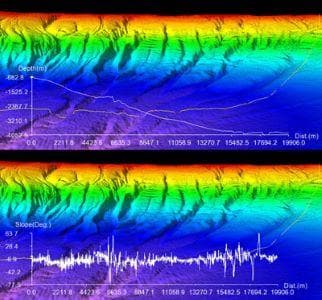
With these techniques, accurate slopes along and across track can be easily computed and incorporated in the calculation of seabed slack. Colored shaded relief images in conjunction with detailed color contour maps can be automatically geo-referenced and incorporated in the overall GIS database to further facilitate the selection of the optimum cable route.

Using the 3D Viewer bathymetry can be viewed from any perspective to assist in choosing the best cable path. Grid maneuvering include zoom, rotate, pan and include a variety of lighting effects. In addition, an optional profile view of the seafloor can displayed depicting the range in depth and distance.
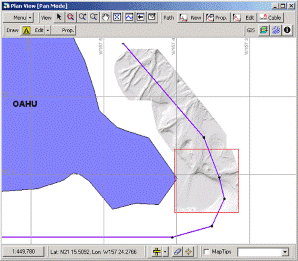
MakaiPlan screenshot with DTM module. A large raw data file has been subdivided into smaller sections using the DTM Manager. The individual sections were then gridded and shaded relief maps were generated from the gridded data. The red square represents a user-defined section of the bathymetry data that can be manipulated independently from other bathymetry sections.

For final approvals and reports, colored shaded relief maps can be projected on top of the grid data using the 3D Viewer to show different perspectives of the cable path. Click here to download an article
Interested in Makai’s Submarine Cable Software and Services?
ReACH OUT!
Contact us by sending in this form any time you need professional support or have any questions. You can also fill in the form to leave your comments or feedback for Makai’s team.